FAQs
How to read my .xlsm mass spec result
- What is LC/MSMS?
- What is shotgun proteomics?
- What is # peptides?
- What is a protein group?
- What is Protein Inference?
- What is # unique peptides?
- What is # PSMs?
- What is a missed cleavage?
- What is MS Amanda Score?
- Which modifications can be identified?
- What are the concerns about mapping PTM sites?
- What can I do to increase the sequence coverage of my protein(s) of interest for mapping PTMs?
- What is ptmRS?
- How is the False-Discovery-Rate (FDR) calculated?
- What is the protein area and iBAQ?
- How is the normalization of the protein areas performed?
- What is m/z?
- What is MH+?
- What is search space?
- What is Isolation Interference [%]?
- What are GO terms?
- What is sequence coverage?
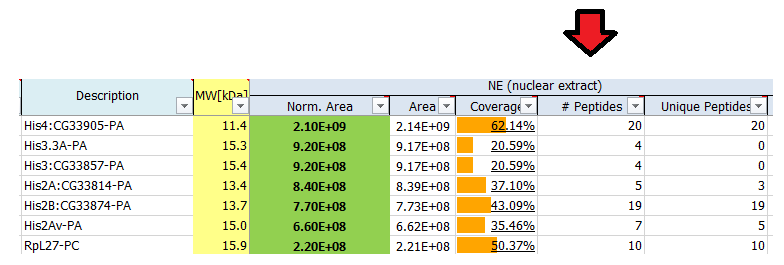
- Why are some protein areas written in bold and some not?
- What is match-between-runs (MBR)?
- Why do you use limma?
- What is limma doing? How does limma work?
- I expected one single protein in the band we cut from the gel, but the result shows one hundred proteins. How come?
- I see quite a lot of keratins in my result list of identified proteins. Where do they come from?
- What is the detection limit and how many proteins can be detected in a typical proteomics analysis?
- Is it possible to distinguish between modifications that differ in decimal region of mass?
- I cannot find my protein of interest in the list of identified proteins. Does this mean it is not in the sample?
- I found some interesting and promising candidates (potential members of my protein complex or binding partners of my protein of interest) in the mass spec result. What can I do next as follow-up to confirm those proteins?
- How can I evaluate the quality of my data?
- What can I do if I cannot find the mass spec result files you sent me anymore?
- Can the raw data be accessed too?
- How to overcome the problem of distinct interaction properties?
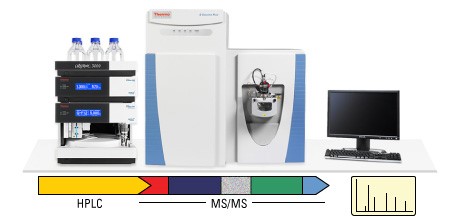
What is LC/MSMS?
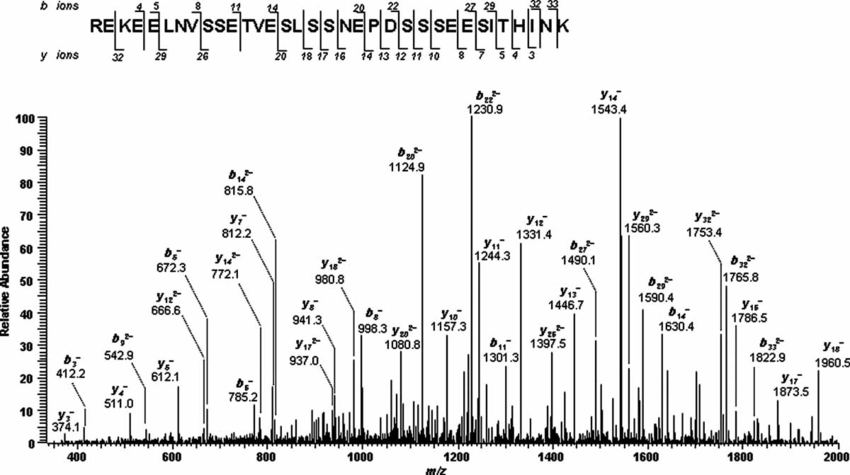
This abbreviation stands for Liquid Chromatography Tandem Mass Spectrometry. The peptides generated during sample preparation are separated by physical properties such as hydrophobicity or charge by liquid chromatography, usually HPLC. Subsequently, the mass spectrometer measures the mass to charge (m/z) ratio of the respective peptides, based on which the molecular weight of the peptides is calculated. In a second MS step, peptides of interest are isolated and subjected to fragmentation. The resulting fragment ion spectrum, MS/MS spectrum, contains information on the amino acid sequence of the peptide and thus enables its identification.
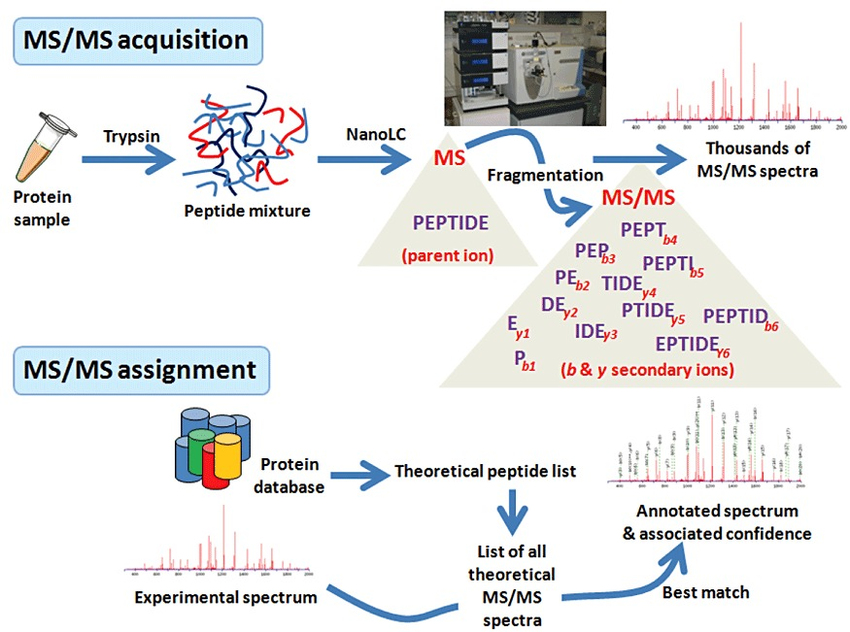
What is shotgun proteomics?
In shotgun proteomics proteins are digested by proteolytic enzymes into peptides. A mass spectrometer can only measure a limited number of peptides at a time, therefore the complex peptide mixture is separated on a nano-HPLC prior to MS analysis. Peptides eluting from the LC are sprayed into the MS and ionized by high voltage in a process called electrospray ionization (ESI).
https://www.ncbi.nlm.nih.gov/pmc/articles/PMC1853331/
Ionisation is essential as a mass spectrometer can only detect charged molecules. The MS acquires mass spectra of peptides that are eluting from the LC (MS spectra) and selects abundant peptides for fragmentation and subsequent analysis (MS/MS spectra). Each single MS/MS spectrum is searched against a database composed of a list of theoretical MS/MS spectra resulting from in-silico digestion of the organism’s proteome. Database hits are scored based on the quality of the match and all identified peptides are assigned to the respective protein hits.
What is # peptides?
The reported number of peptides is the total number of distinct peptide sequences identified for the protein group.
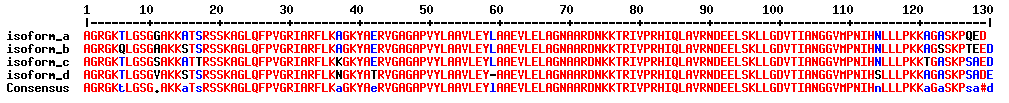
What is a protein group?
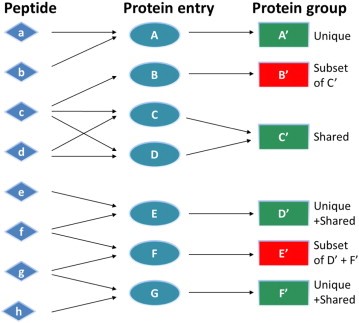
Not all identified peptides can be uniquely assigned to a single protein in the database. This is for example the case for protein isoforms or homologous proteins, where identical sequence parts generate identical peptides. Therefore, when an identified peptide could belong to several proteins, these proteins are classified into a protein group. Each group is represented by a master protein, which is the protein most likely present in the sample (usually having the highest number of peptides and highest molecular weight). The master protein is identified by a set of peptides that is not part of another protein group. All proteins in the group are identified by the same set of peptides or a subset thereof. A subset of the same peptides in combination with at least another unique peptide may form a distinct protein group.
Counting protein groups gives a more realistic estimate of the number of proteins contained in the sample as compared to counting the number of proteins for which peptides were found.
In the depicted example protein group A’, C’, D’, F’ will be reported.
What is Protein Inference?
When MS/MS spectra are searched against a peptide sequence database, in most cases, the matched peptides are not unique to a single protein. Yet, we usually want to know which proteins were present in the sample. So, we are faced with the challenge of protein inference: given a set of peptide matches, which proteins do we believe were present in the sample?
The usual approach is based on the "Principle of Parsimony". We report the minimum set of proteins that account for the observed peptide matches. If we had four peptide matches, two of which occurred in protein A and two in protein B but all four were found in protein C, we would report that protein C had been identified. Proteins A and B might be listed as "sub-set" proteins. It is perfectly possible that our sample actually contained a mixture of proteins A and B, but there is no evidence for this.
What is # unique peptides?
Unique peptides reflect the number of peptide sequences that are unique to the protein group which is represented by the listed master protein. These peptides do not occur in proteins of any other group. The master protein contains all of the listed unique peptides, other proteins in the group may contain only a subset of them.
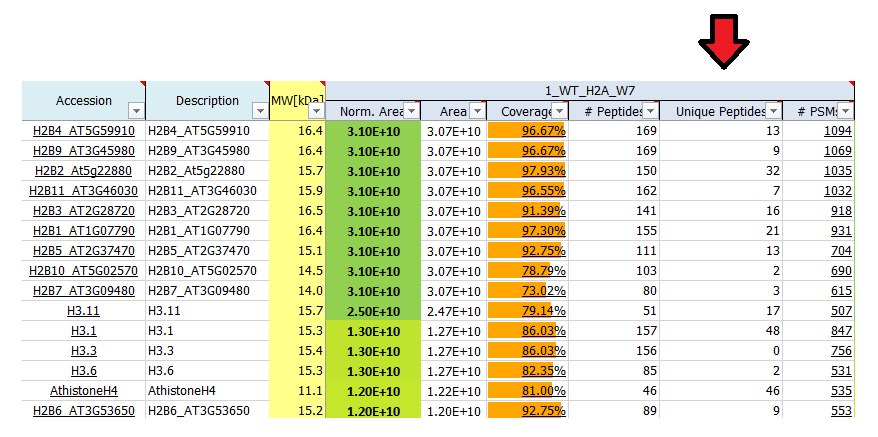
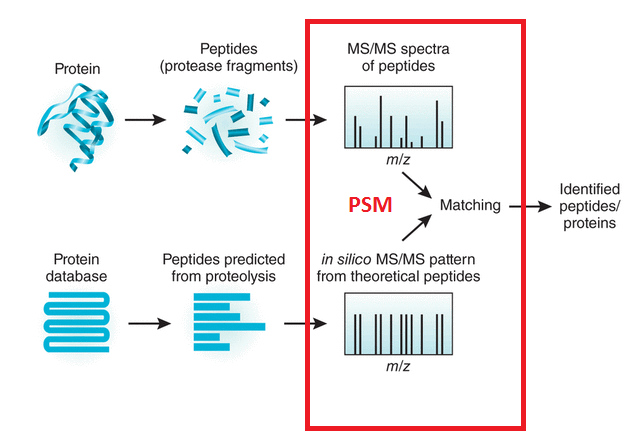
What is # PSMs?
# PSM (peptide spectrum match) is the number of MS/MS spectra that were matched to peptide sequences for a given protein. For highly abundant peptides often more than one spectrum is recorded, therefore the # PSM value may be higher than the number of peptides identified. As such, the # PSM can be used as a label-free method for semi-quantitative quantification (spectral counting), as # PSMs reflects the abundance of corresponding peptides.
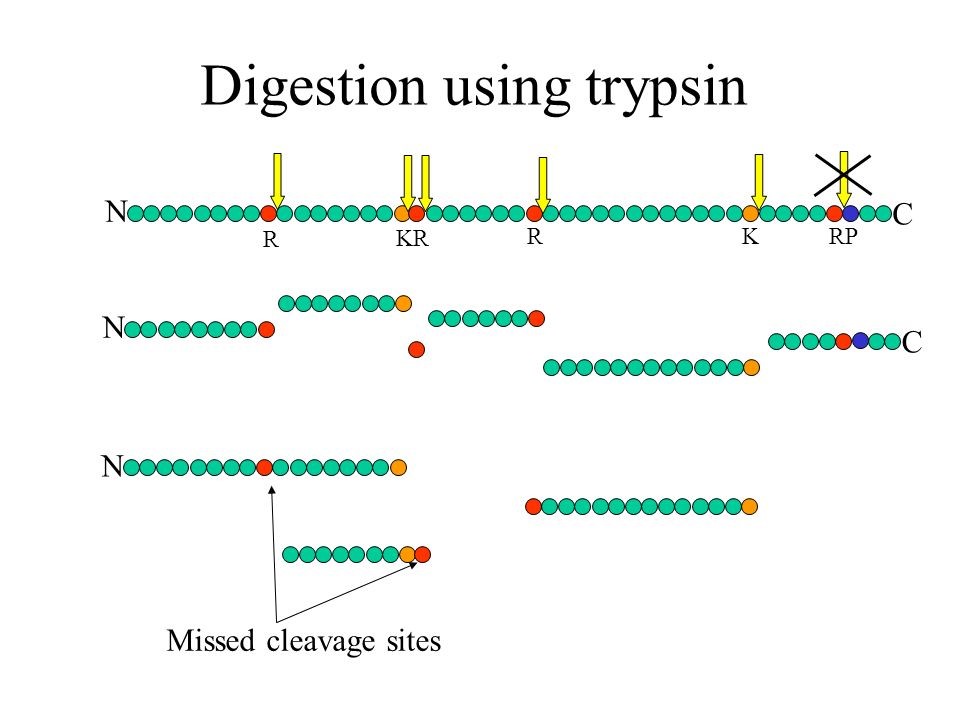
What is a missed cleavage?
The number of cleavage sites in a peptide sequence that an enzyme did not cleave. This number excludes cases where an amino acid (e.g. Pro) inhibits the cleaving enzyme (e.g. trypsin).
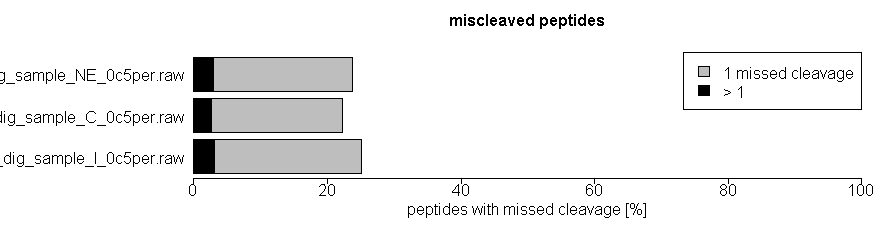
As quality control of efficiency and reproducibility of protein enzymatic digestion we also report number of missed proteolytic cleavage sites. Typically, up to 2 of these missed cleavages are considered by the bioinformatics search tools, usually after digestion of the in silico proteome by trypsin. We also plot the number of miscleaved peptides in the quality control tab in the xlsm result file we provide.
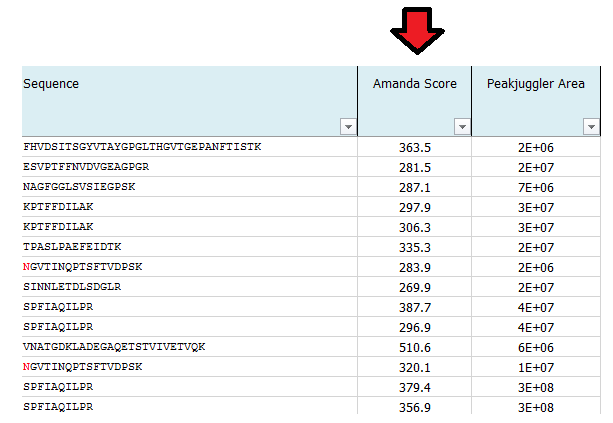
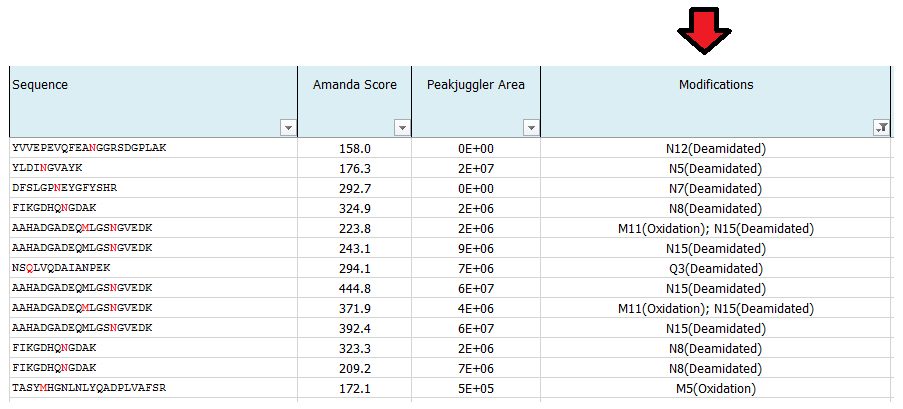
What is MS Amanda Score?
The Amanda score is a probabilistic search engine identification score for each spectrum (PSM). Amanda uses probability based scoring. This enables a simple rule to be used to judge whether a result is significant or not. The higher the score the higher the probability for a true hit. To fulfill high quality criteria we set a cut-off of 150 for the Amanda score.
https://www.ncbi.nlm.nih.gov/pmc/articles/PMC4119474/

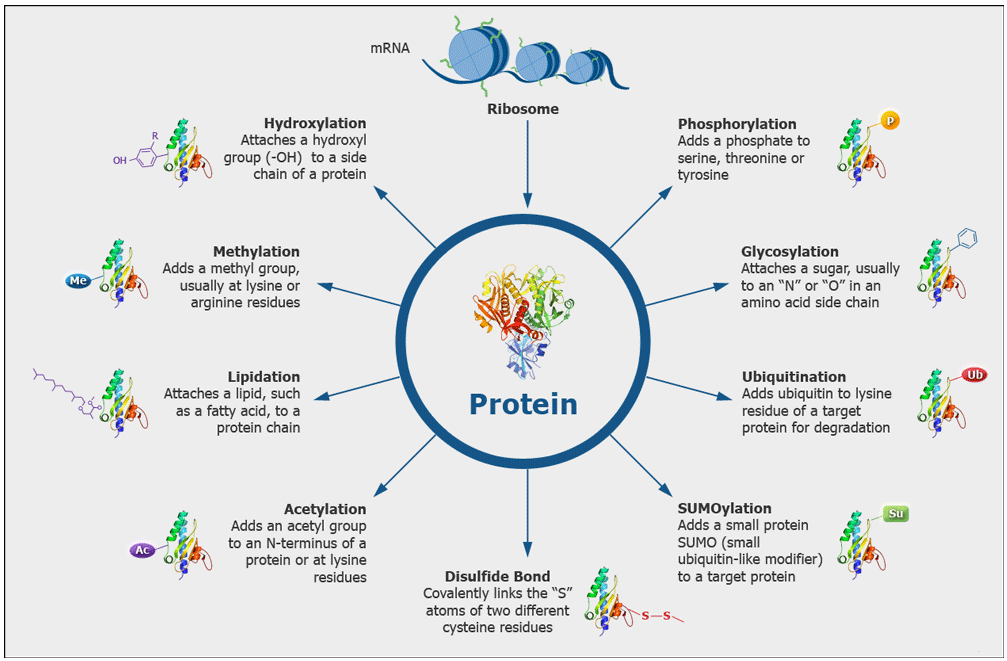
Which modifications can be identified?
We routinely search for post-translational modifications such as Phosphorylation (S, T, Y), Acetylation (K), Ubiquitination (K), Methylation (K, R), Dimethylation (K, R), Trimethylation (K). Additionally, we search for modifications that may be introduced during samples preparation, such as oxidation (M) and carbamidomethylation (C) that we generate by reduction and alkylation of cysteine disulfide bonds. We can also search for many other modifications which we have to define in the search parameters, but we cannot search simultaneously for every possible modification.
What are the concerns about mapping PTM sites?
The higher the sequence coverage of the protein of interest, the greater the statistical chance to detect and identify the peptide carrying a modification group. PTMs often occur in a sub-stoichiometric manner, meaning if the site occupancy of a certain modification is low, then the chance of detecting the modified peptide also decreases.
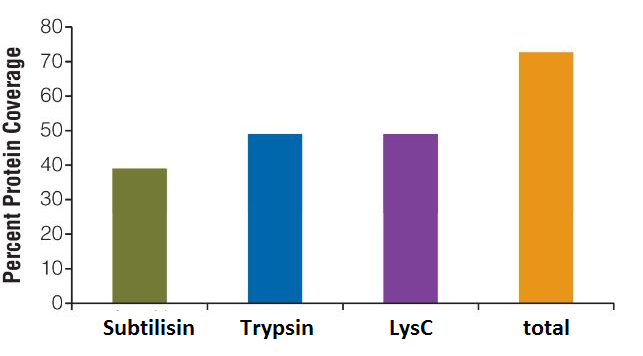
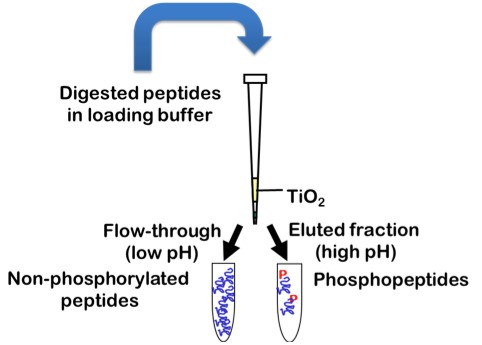
What can I do to increase the sequence coverage of my protein(s) of interest for mapping PTMs?
Protein sequence coverage can be increased by starting the sample preparation with higher protein amounts, by gaining higher purity of the protein of interest, by using multiple enzymes with different specificity for protein digestion or by application of enrichment techniques for specific PTMs, such as TiO2 for enrichment of phosphorylated peptides.
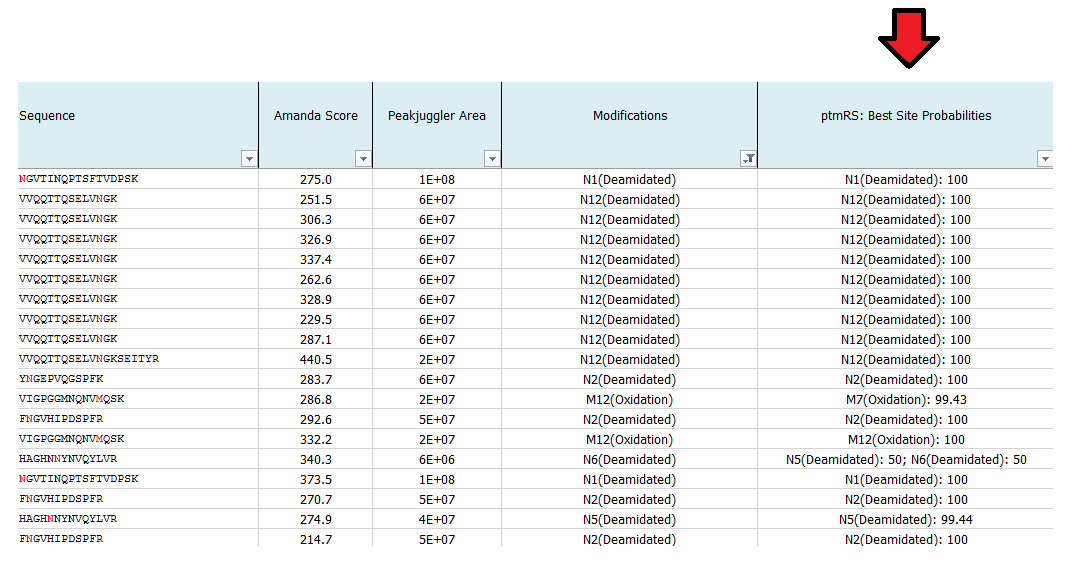
What is ptmRS?
ptmRS is an algorithm for the assignment of PTM sites in peptides. The program uses MS/MS spectra in conjunction with the respective peptide sequences to calculate site probabilities for all potential modification accessor sites. The ptmRS score is a calculated site probability for a modified residue (localization probability) using site-determining ions of the tandem mass spectrum. The algorithm was developed in our group and we mainly use it to calculate site localization probabilities for phosphorylation sites.
https://www.ncbi.nlm.nih.gov/pubmed/22073976
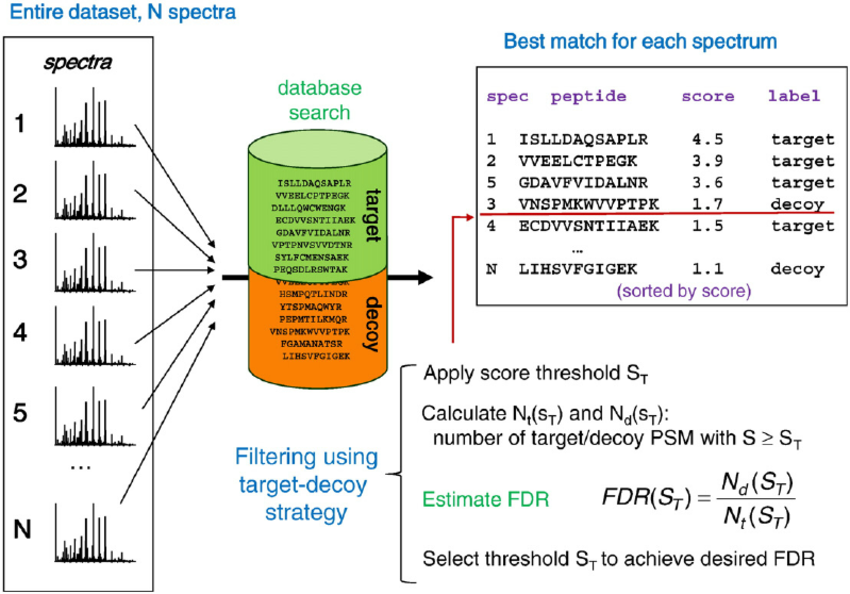
How is the False-Discovery-Rate (FDR) calculated?
With the advancement in proteomics separation techniques and improvements in mass analyzers, the data generated in a mass-spectrometry based proteomics experiment is rising exponentially. Such voluminous datasets necessitate automated computational tools for high-throughput data analysis and appropriate statistical control. The data is searched using one or more of the several popular database search algorithms. The matches assigned by these tools can have false positives and statistical validation of these false matches is necessary before making any biological interpretations. Without such procedures, the biological inferences do not hold true and may be outright misleading. There is a considerable overlap between true and false positives. To control the false positives amongst a set of accepted matches, there is a need for some statistical estimate that can reflect the amount of false positives present in the data processed. False discovery rate (FDR) is the metric for global confidence assessment of a large-scale proteomics dataset. In common applications of target-decoy strategy for FDR assessment all MS/MS spectra from the entire experiment are searched against a composite target plus decoy protein sequence database. To calculate the FDR, the recorded MS/MS spectra are searched-using identical search parameters – both in a real (target) database and against a decoy database in which all sequences have been reversed or randomized. The best peptide match for each spectrum is selected for further analysis. The numbers of matches to decoy peptides are counted and used to estimate the false discovery rate (FDR) resulting from filtering the data using various score thresholds. In more detail, Percolator, the node applied for FDR assessment, uses a semi-supervised machine learning to discriminate correct from incorrect peptide-spectrum matches, and additionally calculates accurate statistics such as q-value (FDR) and posterior error probabilities.
Methods Mol Biol. 2016;1362:119-28. doi: 10.1007/978-1-4939-3106-4_7
What is the protein area and iBAQ?
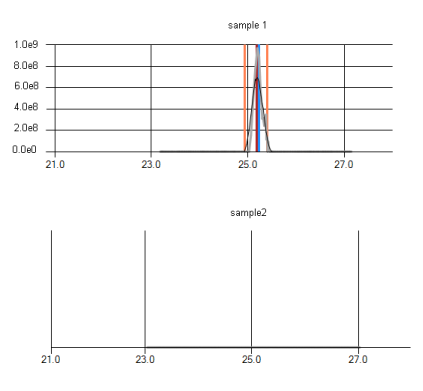
Adding up the intensity of an eluting peptide over time is a quantitative measure of the peptide’s abundance. It enables relative quantification by comparing the amount of a peptide between samples. As peptides ionization ability is strongly variable, comparisons between different peptides are not possible. Nevertheless, adding up the integrated signal of several peptides belonging to a protein also enables the comparison of the protein amount between samples – relative quantification. The protein area is calculated by summing up the peak areas of the top three peptides and is a semi‐quantitative value reflecting the protein abundance.
Another option is iBAQ: here the sum of intensities of all tryptic peptides for each protein is divided by the number of theoretically observable peptides. Each peptide produces a signal in the MS, whose intensity is measured and the area under the curve is calculated. All peptide areas belonging to one protein are summed up according to certain criteria (including or excluding peptides which are not unique for a certain protein isoform). These protein areas are then divided by the number of theoretical peptides for this protein. This quantification is called iBAQ (Intensity Based Absolute Quantification) and iBAQ values are proportional to the molar quantities of the proteins. The iBAQ algorithm can roughly estimate the relative abundance of the proteins within each sample.
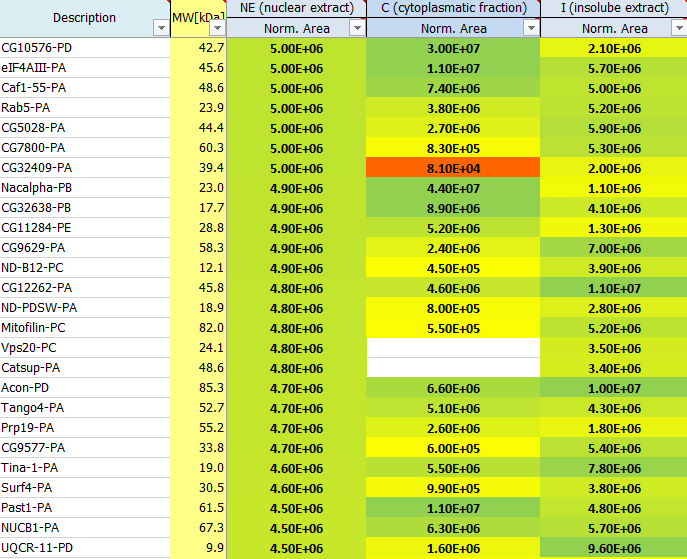
These are estimates which can be used to rank proteins according to their abundance: 1E4 is quite low and represents background signals, noise close to the detection limit, whereas 1E10 is quite high, reflecting very abundant proteins. Often the used proteases, antibodies or also contaminants like keratins show up on top of the most abundant proteins identified in a mass spec run. In a good affinity purification experiment the bait protein should show up among the top 20 hits.
How is the normalization of the protein areas performed?
Raw sample areas are normalized to account for different sample amounts loaded onto the MS. This allows comparison of protein amounts over different samples. Therefore, samples with high total sum are divided by a factor, whereas samples with low total area are multiplied by a linear factor such that all samples finally have the same total area sum after normalization.
What is m/z?
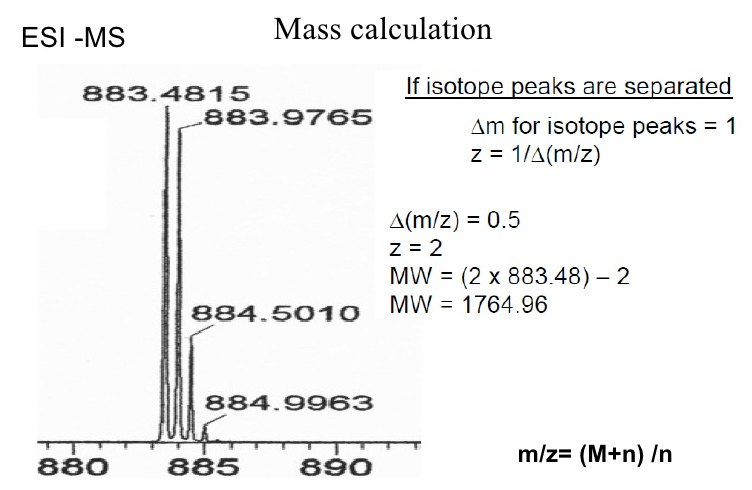
A mass spectrometer does not detect the actual molecule mass but rather the ratio between its mass (m) and its charge (z), m/z. All molecules have at least a charge of 1, as a mass spectrometer only detects charged molecules. Molecules that are multiply charged appear lower on the m/z scale.
To determine the actual mass of a molecule from its m/z value, its charge state has to be identified. For this, the molecules isotope pattern is used. http://www.ionsource.com/tutorial/isotopes/slide2.htm
From the m/z difference between a peak and its isotope peaks the charge state is calculated (e.g. difference of 1 Da: z=1; difference of 0,5 Da: z=2, …) and from this the actual mass of the molecule is determined.
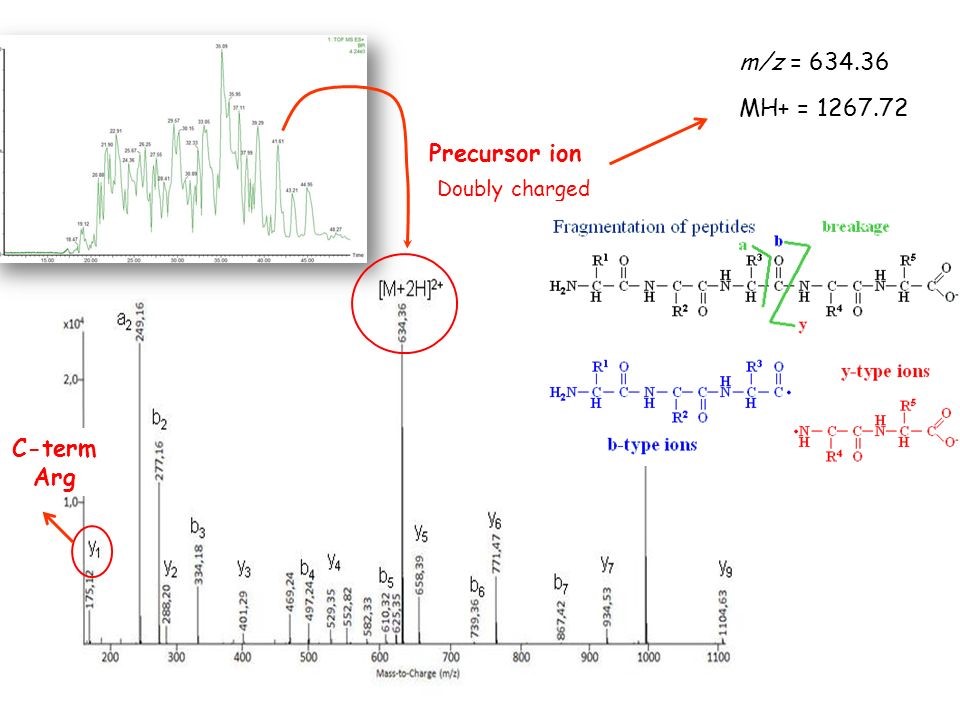
What is MH+?
MH+ is the peptide mass of a singly charged molecule, which can be calculated from the measured m/z. MH+ is composed of the mass of the molecule M plus the mass of a proton H+ which creates the positive charge and increases the mass by 1 Da. The ion mass detected is therefore one unit higher than the monoisotopic mass of the uncharged molecule.
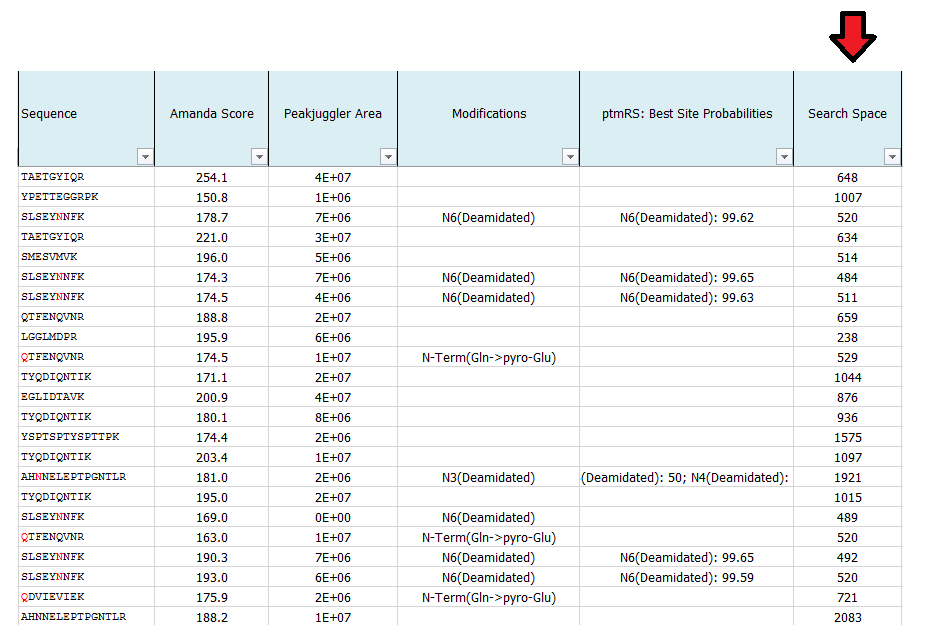
What is search space?
This number indicates the number for possible candidates of each individual spectrum in the used database. The larger the database and the higher of the number of potential cleavages sites and missed cleavage sites, the higher the search space. The same is true for the number of dynamic modifications.
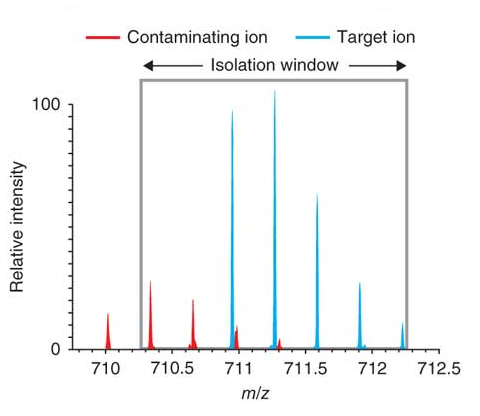
What is Isolation Interference [%]?
To create a fragment spectrum, you select a precursor mass (=peptide) for isolation, isolate and fragment the ions within a mass window that you define, and record the product ion masses created.
Ideally, you would isolate and fragment only the precursor ions of a single selected component. However, in practice you isolate the precursor ions within a user-specified window—typically 1 or 2 Daltons around the isolation mass. Co-eluting components with a mass falling into this isolation window are also isolated and fragmented. This process is called co-isolation.

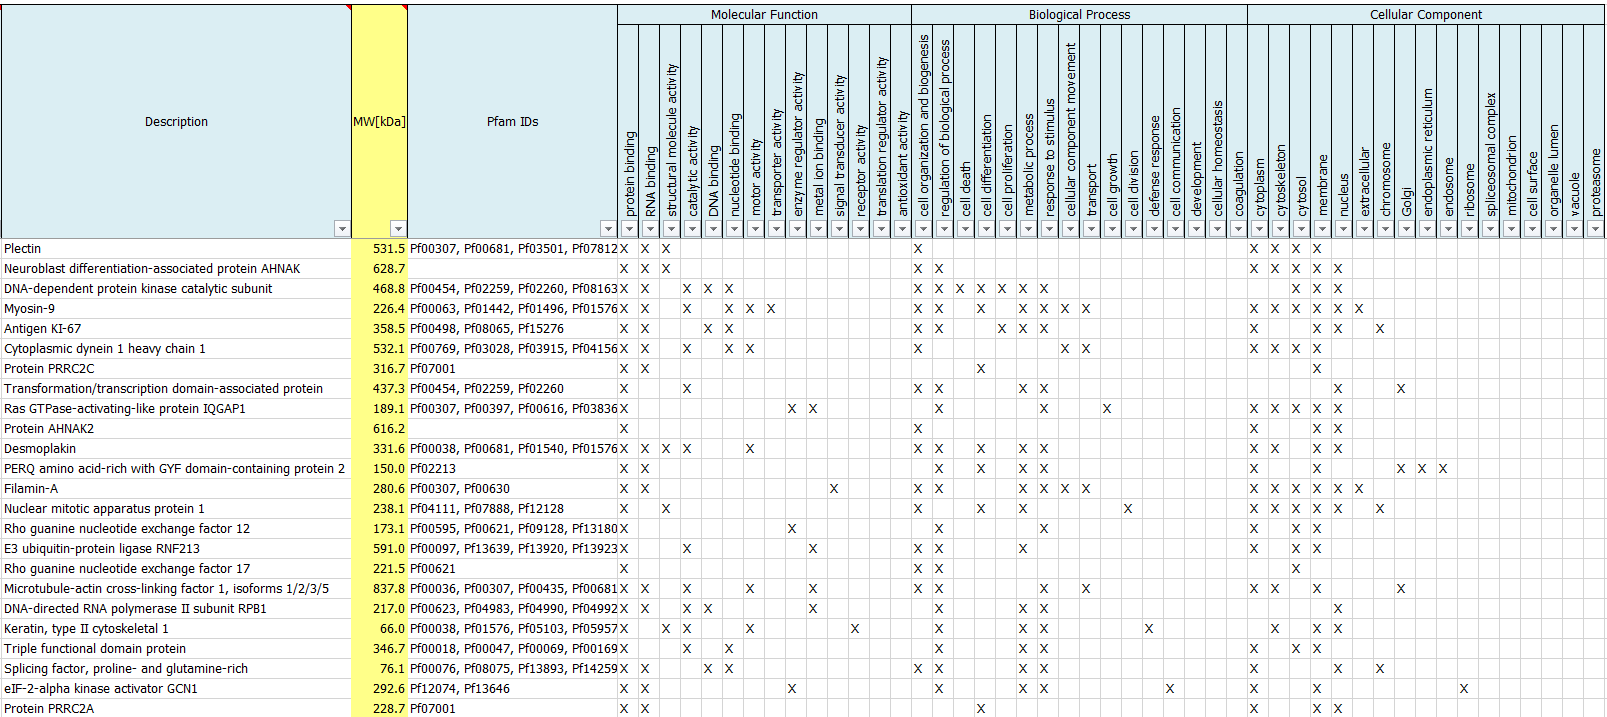
What are GO terms?
We routinely perform a Gene Ontology Analysis to report Gene Ontologies for Molecular Functions, Cellular Components, Biological Processes as well as protein families (Pfam IDs) of identified proteins.
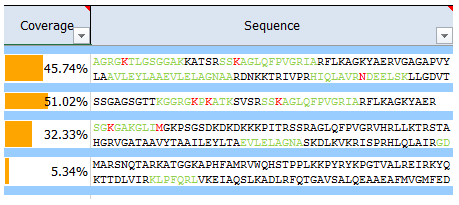
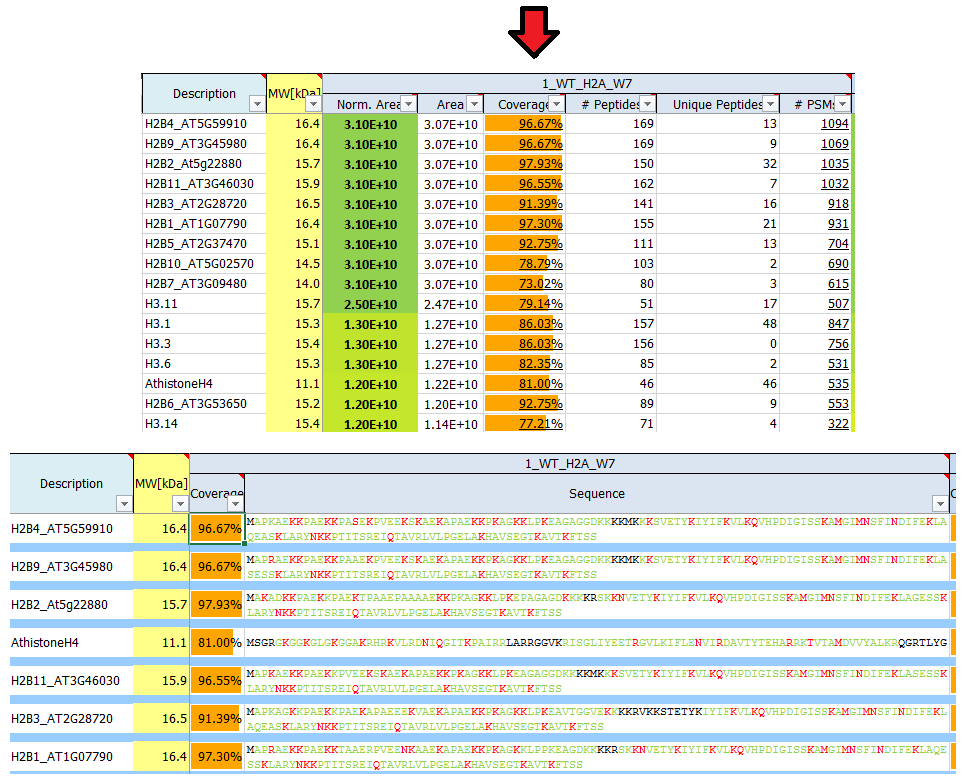
What is sequence coverage?
Sequence coverage is the percentage value of how many amino acids of a protein are identified.
If identified peptides cover 200 residues in a 1.000 amino acids long protein, sequence coverage would be 20%. Sequence coverage can vary from 0 to 100%, as often not all peptides belonging to protein are detected in the sample. This is dependent many factors, such as protein sequence, protein length, abundance in the sample, complexity of the sample, etc.
Identified (covered) amino acids are highlighted in green.
Amino acids that are identified with modifications are highlighted in red.
Black amino acids indicate no identification.
Why are some protein areas written in bold and some not?
If a protein area is written in bold, it means that this protein has been identified by a certain number of peptides the area of which was subsequently quantified. If a protein area is not written in bold, this protein has not been identified by the search engine directly, but it has been quantified using a method called ´match-between-runs´.
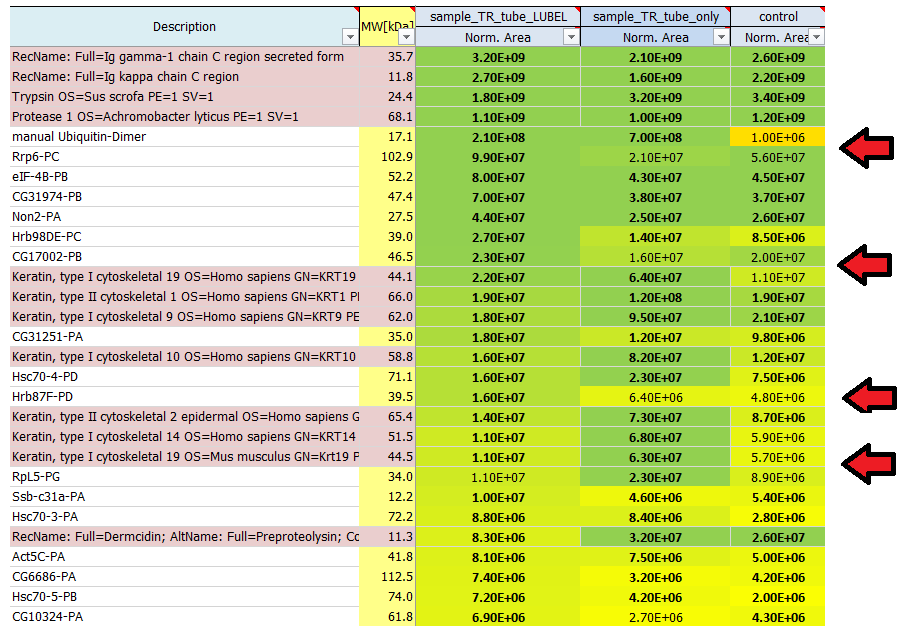
In order to be able to calculate some kind of ratio ('fold change') we perform imputation to empty values. This is also indicated by 'italic' expression of the value.
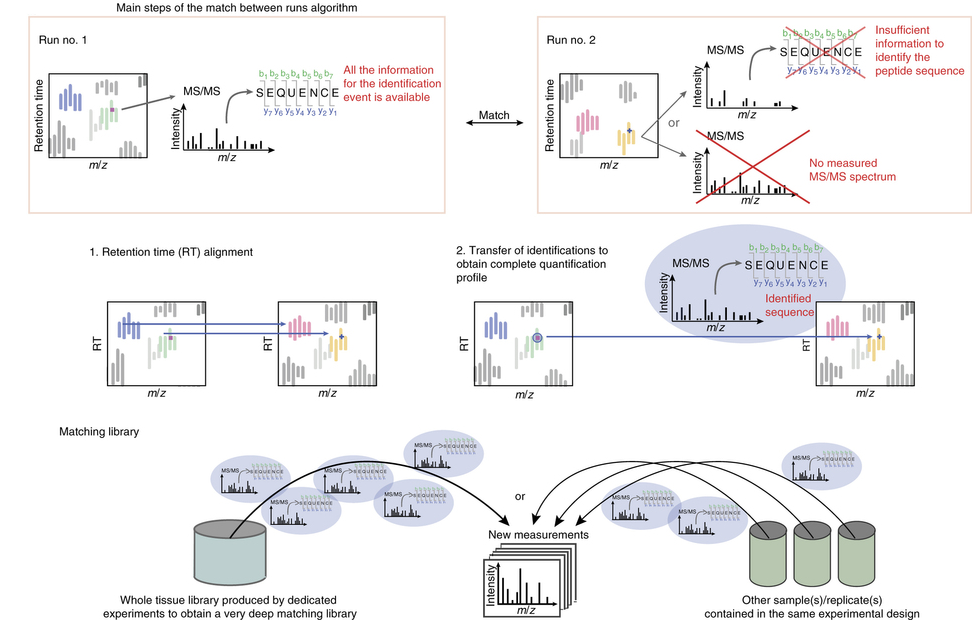
What is match-between-runs (MBR)?
Ideally, for each MS run there is enough information available to retrieve the peptide sequence from the measured MS/MS spectrum. However, sometimes the available information is not sufficient for peptide identification; either the measured MS/MS spectrum is insufficient to identify the sequence or the peptide was not even fragmented. In this case, the MBR algorithm comes into play.
It determines an “elution profile” of an identified peptide (m/z, z and retention time) in one run of the experiment (e.g. the control), and looks for the same elution profile in another run of the same experiment (e.g. the sample), where the peptide was not identified.
To obtain an identified feature, MS/MS and sequence information from one run are matched within tight mass and retention time windows. For this purpose, the runs are first aligned by their retention times, and then the identification(s) are transferred from the run containing the necessary information to the one(s) with insufficient information. The corresponding peak will be integrated and the respective area is calculated.
Why do you use limma?
limma is a statistical test especially suited when the number of replicates is low, which is the case in most biological experiments. Nevertheless it can not estimate the significance if less than three replicates per condition are available. For more detail see Schwämmle et al.
What is limma doing? How does limma work?
limma can compute the statistical significance of differentially abudant proteins. Obviously this requires availability of replicates. In contrast to a conventional t-test, limma uses the variance information of all individual proteins to estimate the variance and statistical significance. This is especially unseful in cases where the number of replicates is low and leads to more robust and reliable results.
I expected one single protein in the band we cut from the gel, but the result shows one hundred proteins. How come?
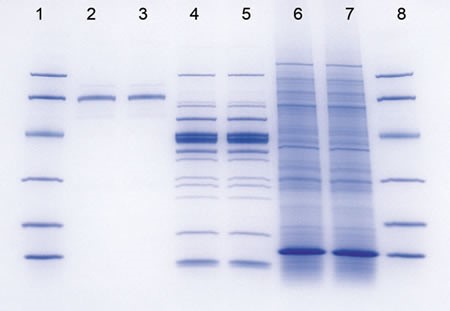
If one single band was excised from a gel, it is not unlikely that this band contains several proteins. These proteins do not necessarily have the same size. Some of the unexpected proteins may be degradation products, some may carry PTMs. Some proteins that show up may be below the detection level of the staining method used. Mass spec by far exceeds the sensitivity of silver staining or coomassie.
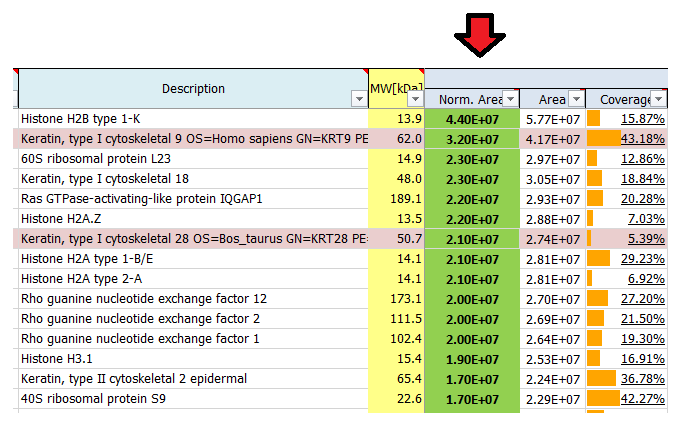
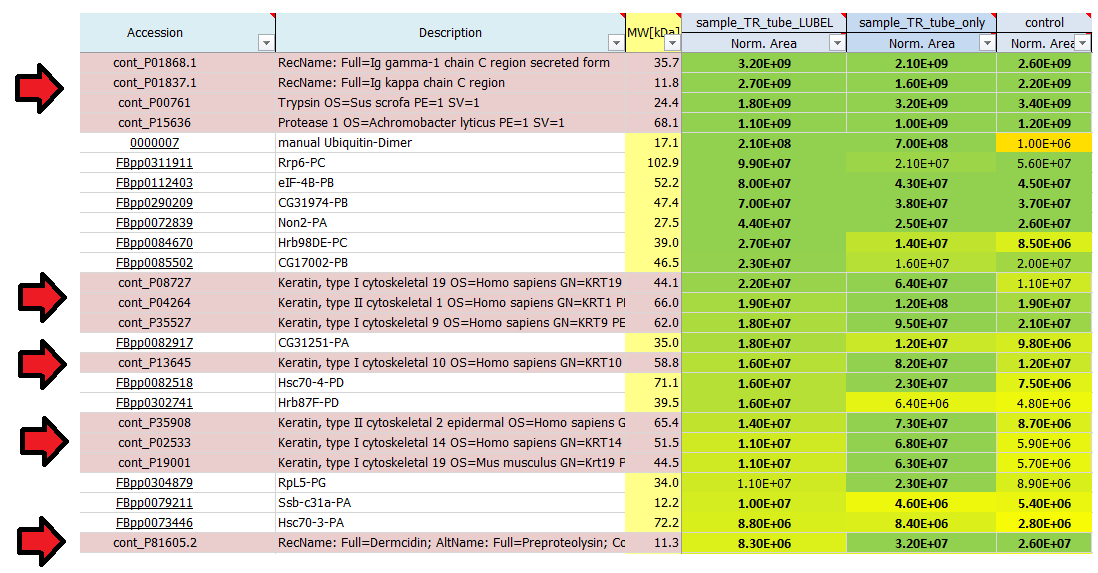
I see quite a lot of keratins in my result list of identified proteins. Where do they come from?
Contaminants like keratins and dermcidin usually come from human contamination and are introduced during sample preparation, staining or cutting. They can origin from air, skin or clothes. We routinely search for a list of known contaminants, in addition to the taxonomy database of the organism used in the experiment, and highlight them in the final result list of identified proteins.
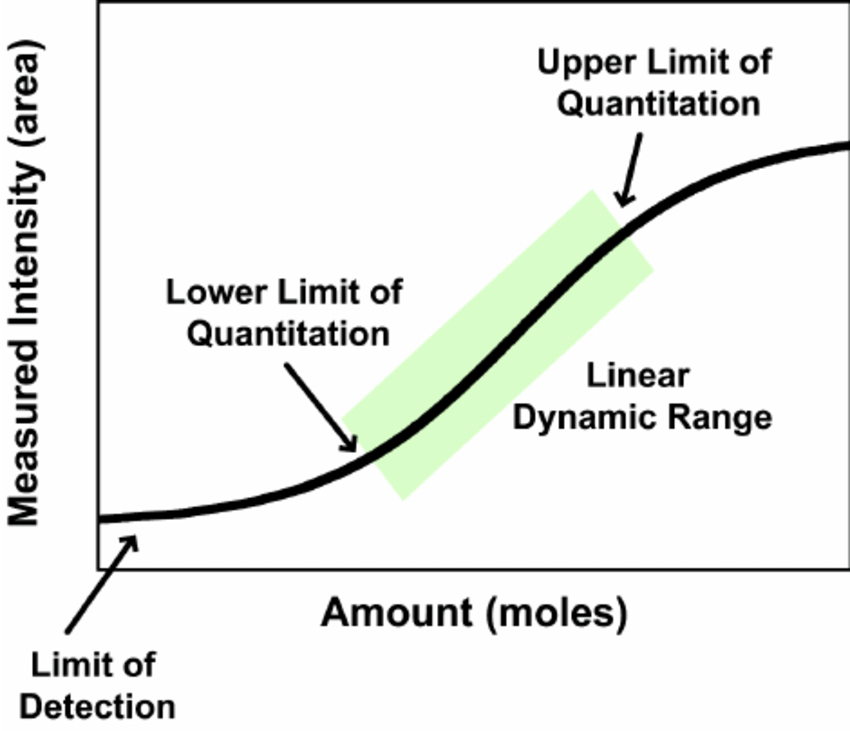
What is the detection limit and how many proteins can be detected in a typical proteomics analysis?
There is no general number to address this question. The number of detectable proteins is dependent on factors such as complexity of the sample, dynamic range of protein concentrations, available material and LC-MS instrumentation being used. The range of detectable proteins in a single mass spec run can vary from a few proteins to several hundred or more than thousand.
The general limit of detection of current state-of-the-art mass spectrometers is in the sub-femtomol and attomol region.
However, the actual detection limit for peptides varies with its so-called “flyability” in the MS machine. A peptide’s flyability is dependent on several properties, such sequence length and composition, ionization efficiency and fragmentation characteristics. Commonly, some peptides of a protein “fly” very well and are therefore highly abundant in the result, while other peptides e.g. are not ionized well and will never be detected.
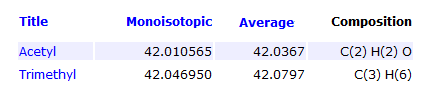
Is it possible to distinguish between modifications that differ in decimal region of mass?
Yes, with current high mass accuracy mass spectrometers one can easily distinguish modifications that differ in decimal region of mass, such as Acetylation and Trimethylation, which differ by 0.04 Da in mass.
I cannot find my protein of interest in the list of identified proteins. Does this mean it is not in the sample?
It is extremely difficult to prove that a protein is definitely not present in a sample, rather than just not detected. The failure to detect a protein could be due to low amount/concentration or because it was masked by more abundant proteins. It is also possible that the peptides of your protein of interest could not be uniquely mapped and a close homolog of your protein shows up in the list instead (see also protein grouping).

I found some interesting and promising candidates (potential members of my protein complex or binding partners of my protein of interest) in the mass spec result. What can I do next as follow-up to confirm those proteins?
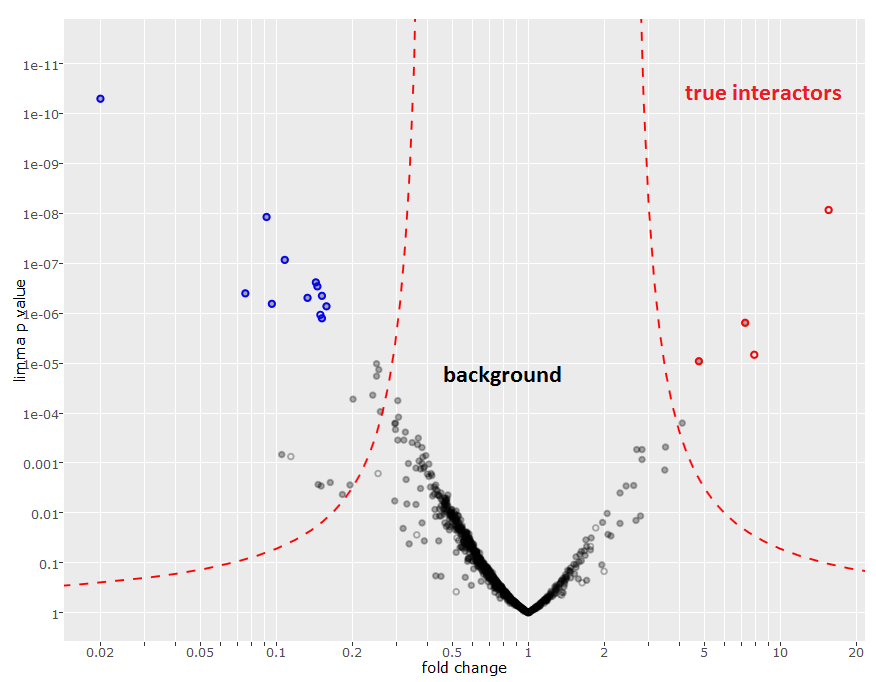
As next step, best would be to repeat the experiment in replicates to see if we can reproducibly confirm initial results. Triplicates (for experiment and control conditions) are needed for a good statistical foundation and to calculate the fold change and associated p-values. For better discrimination of true interactors and background proteins these values can be visualized as a volcano plot.
How can I evaluate the quality of my data?
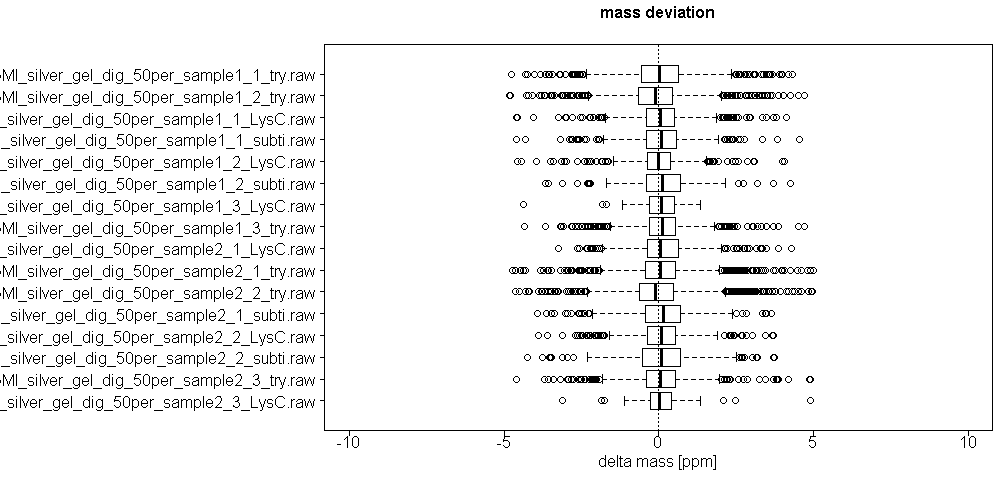
We monitor several parameters of LC and mass spec machines, calibrate machines on a regular base, perform quality control runs before, after and in between sample runs and additionally introduce washing steps before, after and in between sample runs to avoid carry-over effects. In the mass spec xlsm result file we provide there is a tab called ´Quality Control´ where several parameters are visualized, such as distribution of mass deviation, number of miscleaved peptides or occurrence of methionine oxidation.
What can I do if I cannot find the mass spec result files you sent me anymore?
We store all result files on a secure server, where we have access to the data at any time.
So if you cannot find your mass spec result anymore, just contact us and we will send you another copy of the original result file.

Can the raw data be accessed too?
We store all the raw data files on a secure server, where we have access to at any time.
So if you wish to have the raw data for yourself or for providing it to a journal, because it was requested by the editors for the reason of transparency, just contact us and we will send you a copy of the original raw data files.
How to overcome the problem of distinct interaction properties?
Many proteins are social and talk to each another in groups called protein complexes. Some other partners are rather “unsocial”, with only limited communication (e.g. signal transduction pathways) and merely engaging in transient interactions (i.e. protein interactions that are easily formed and broken).
Partnering proteins can be “glued” together using a tool called cross-linker (e.g. formaldehyde).
As an example, you can work with 0.75 % formaldehyde and in-vitro crosslink proteins on beads in a protein extract. Incubation time could be 10 minutes; if you “over-crosslink” your proteins you will probably increase unspecific protein background.
Possible points to consider:
- Formaldehyde oxidizes to paraformaldehyde if not kept tightly closed. While formaldehyde is a zero-length cross linker, paraformaldehyde is not.
- Formaldehyde crosslinking -like any other crosslinker- is dependent on the substrate concentration. If you are performing in-vivo crosslinking, make sure that each of the binding partners are expressed at right level. Having controls is the key.
- Crosslinking is also highly temperature dependent. So, using cold or warm PBS can affect not only the crosslinking of your target complex, but also background non-specific crosslinks.
- If controls suggest that each of the binding partners are expressed as expected, working formaldehyde concentration may require some optimization.
- Low concentrations of formaldehyde are mass spec compatible
Please use Methanol-free FA, as the stabilized solution from store can be used for desinfection, but is not appropriate for biochemical or cell biology tasks.